
The Event Detail
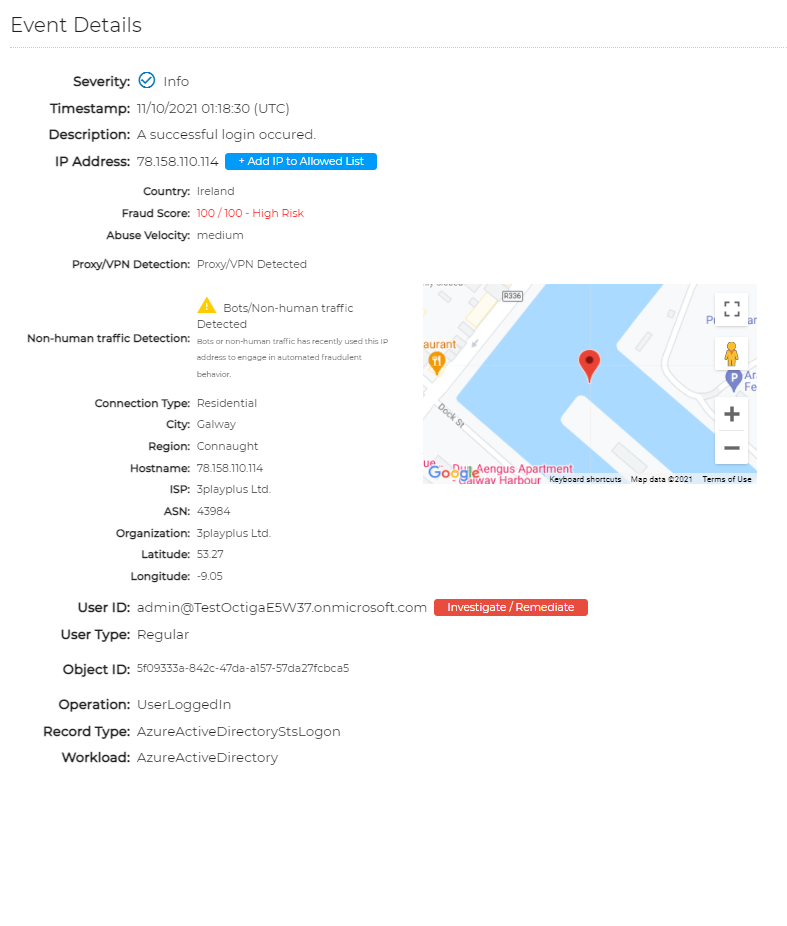
Each event, whether it was reported as an alert or is just informational (info level) can have its detail inspected in order to gain further insight into the activity which generated it.
The event detail popup contains a number of informational sections. We will not go over every field but rather highlight a few that are very useful in triaging a breach or risk.
- Severity - The severity level as characterised by Octiga
- Timestamp - When the event was registered in Microsoft
- IP Address - The IP of the machine where the action originated.
- Country
- Fraud Score - OCtiga use an up to date third party to identify potentially risky networks and network locations
- User ID - The affected user
- Operation - The Activity being performed. More details here
- Record Type - The feature or service the action was triggered on. More details here
The Map
Most events (but not all) have unique locations at which they originated. In this case, an interactive google map will be displayed.
You can zoom in and out and around the map just as you would on Google Maps
The location information is the one registered with the IP address in question. It should be noted that this location is sometimes approximate, for example, it will show the downtown location of the city in which the IP address is known to generally reside. Other times the IP address will be highly accurate and reference a unique address or building that the network provider has registered the IP at.
